
Rental Report Q1 2026 - Dutch rental prices outpace house prices
Unregulated housing sector increasingly out of reach as affordable supply continues to shrink
Rotterdam, 10 april 2026 - Rents in the unregulated housing sector rose faster than house prices in the first quarter of 2026, according to an analysis by property portals Pararius and Huurwoningen.nl. Compared with a year earlier, average rents per square metre increased by 7.3 percent. House prices rose by 5.1 percent over the same period, while inflation stood at 2.1 percent. Supply in the more affordable segment continues to shrink and is shifting further towards higher price ranges: 42 percent of all available homes in the unregulated housing sector now command a monthly rent above €2,000, compared with 36.5 percent a year earlier.
Number of available rental properties Q1 2026
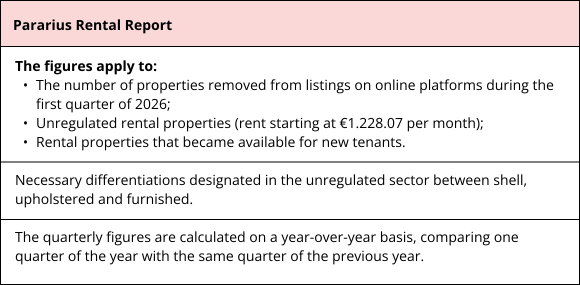
In the first quarter of 2026, 12,947 homes in the unregulated housing sector became available for new tenants. Over the same period, 14,816 properties were withdrawn from the market. As a result, 1,869 more homes left the market than were added. By comparison, this gap stood at just 469 properties in the first quarter of 2025. The net outflow is therefore four times larger than a year earlier.
Average number of responses per listing
In the first quarter of 2026, homes in the unregulated housing sector received an average of 25 responses. This represents a decline of 46 percent compared with the same quarter a year earlier, when properties attracted an average of 46 responses, and is the lowest level since the second quarter of 2021.
Fewer responses do not automatically mean less competition. The decline is partly linked to the shifting composition of supply: as fewer homes are available in the more affordable segment of the unregulated housing sector, there is simply less to respond to. Demand is therefore concentrated on a smaller portion of the available supply, keeping pressure on that segment persistently high.
Pararius defines the price range from the deregulation threshold (€1,228.07 since 1 January 2026) up to €1,500 per month as the most affordable segment of the unregulated housing sector, and it is precisely this category where market pressure is greatest. This segment accounts for just over a fifth of available supply (21.4 percent), yet attracts more than a third of all responses (34.5 percent). Demand is therefore disproportionately concentrated in this price range.
The €1,500 to €2,000 per month bracket has become the focal point of demand. With 41.8 percent of all responses directed at 36.6 percent of supply, this segment attracts considerable interest. Two years ago, just 27.6 percent of all responses were aimed at this price range. Tenants who can no longer access the most affordable segment of the unregulated housing sector are increasingly being pushed towards this more expensive alternative.
The shift on the supply side is equally notable. Over 42 percent of all available homes in the unregulated housing sector now command a monthly rent above €2,000. A year earlier, in the first quarter of 2025, that figure stood at 36.5 percent.
In the first quarter of 2026, homes in the unregulated housing sector were listed online for an average of 22 days. This is two days longer than in the same quarter a year earlier. The slightly longer listing period is linked to the shift in supply towards higher price ranges, where properties are accessible to a smaller pool of tenants and therefore attract fewer responses on average.
Pressure on the Dutch rental market
To provide insight into the balance between supply and demand in the unregulated housing sector, Pararius uses its tightness indicator. This measure combines four elements: the total available housing stock, the number of new listings, the average time properties remain advertised and the average number of responses per home.
In the first quarter of 2026, the tightness indicator stood at 1.11, up from 0.46 in the same quarter a year earlier. The increase is primarily attributable to the declining number of responses per property and the slightly longer average listing period. However, this does not represent a meaningful improvement for people searching for a home: a score of 1.11 still indicates a firmly landlord-favoured market. The threshold of 5, the point at which the market reaches its earliest stage of balance, remains far out of reach. The unregulated housing sector therefore remains structurally tight.
Average rent vs. required gross income
In the first quarter of 2026, tenants moving into a home in the unregulated housing sector paid an average of €1,892 per month. This is €109 more than a year earlier (+6.1 percent) and €389 more than two years ago (+25.9 percent), when the average monthly rent still stood at €1,503.
This rise in rents has a direct impact on the income requirements set by landlords. As a general rule, landlords in the unregulated housing sector typically require tenants to earn at least three times the monthly rent. In the first quarter of 2026, this translated into a required gross monthly income of €5,676, nearly €327 more than a year earlier. The income threshold is therefore rising faster than most wages, placing a growing number of households in an increasingly difficult position.1
The Pararius Rental Price Index (PRP)
The Pararius Rental Price Index tracks the development of rental prices, house prices and inflation relative to the 2021 base year. In the first quarter of 2026, rental price growth outpaced both house price growth and inflation, as it did in the fourth quarter of 2025. Rents have therefore risen more strongly than house prices for two consecutive quarters.
Compared with the first quarter of 2025, rents per square metre increased by 7.3 percent. House prices rose by 5.1 percent over the same period, while inflation stood at 2.1 percent.
For a long time, rental price growth lagged behind both house prices and inflation. From the first quarter of 2025 onwards, rents began to close that gap, rising faster than inflation while house price growth slowed. Compared with the 2021 base year, rents have now increased by 34.9 percent, house prices by 43.7 percent and inflation by 24.8 percent.
Shift from rental to owner-occupied market
In the first quarter of 2026, 5.5 percent of all properties listed for sale on Pararius had previously been offered as rental homes in the unregulated housing sector. This phenomenon, commonly referred to as sell-off or divestment, appears to be continuing its decline. By comparison, this figure stood at 7.6 percent a year earlier and reached its peak of 7.7 percent in the third quarter of 2024.
Jasper de Groot, CEO of Pararius: "The sell-off is slowing, but remains structural. Before 2023, the share of divested rental homes was consistently around 2.5 percent. The current level is still more than double that."
The underlying causes are well established. The combination of the Affordable Rent Act, higher tax pressure under box 3 and the abolition of temporary tenancy agreements has made letting property unattractive for many private landlords. The consequences are visible in figures from the Dutch Land Registry: investors sold more than 65,000 rental homes in 2025 while purchasing just 27,000, resulting in a net loss of approximately 38,000 homes from the rental market; a gap that has grown structurally in recent years.2
De Groot: "It is not only private landlords who are exiting the market. Vesteda, the largest residential landlord in the Netherlands, is likely to sell thousands of rental homes as investors unwind positions worth more than four billion euros.3 If institutional players also begin divesting, the question arises as to who will build and let homes in the mid-market segment."
Movement in the opposite direction remains limited. In the first quarter of 2026, 1.3 percent of all rental homes listed on the market had previously been owner-occupied properties.
Average rent per square metre by property type
In the first quarter of 2026, new tenants paid an average of €21.12 per square metre for a home in the unregulated housing sector. This is 7.3 percent more than a year earlier, when the average rent per square metre stood at €19.68.
The increase was visible across both property types. For apartments, new tenants paid an average of €22.40 per square metre, an increase of 7.8 percent compared with the first quarter of 2025. Rents for single-family homes rose by 6.9 percent to €16.83 per square metre.
Delivery types in the Netherlands
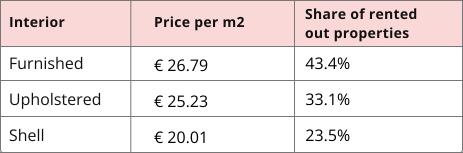
Pararius distinguishes three delivery types: shell4, upholstered5 and furnished6. In the first quarter of 2026, furnished homes accounted for 43.4 percent of all available properties in the unregulated housing sector, making it the largest segment for the first time. A year earlier, this figure stood at 35 percent. The share of shell properties fell over the same period, from 31.7 percent in the first quarter of 2025 to 23.5 percent in the first quarter of 2026.
Furnished homes are also the most expensive. New tenants paid an average of €26.79 per square metre, compared with €25.23 for upholstered and €20.01 for shell properties. The shift towards furnished homes is therefore directly contributing to rising average rents, as more expensive properties now account for a larger share of available supply than before.
Rental price developments in Dutch cities
In the first quarter of 2026, rents per square metre rose in most cities compared with a year earlier. The figures are based on cities where at least thirty homes in the unregulated housing sector were withdrawn from the market during the quarter.
Within the G5, Rotterdam (+10.4%, €22.78) and Eindhoven (+10.0%, €19.55) recorded the strongest increases. Amsterdam remains by far the most expensive city in the Netherlands, with an average rent of €28.53 per square metre, up 5.1 percent year on year. The Hague (+6.5%) and Utrecht (+5.9%) followed with more moderate increases.
Outside the G5, rents also rose sharply in many cities. Den Bosch (+14.9%, €20.24) and Almere (+14.6%, €19.44) recorded the largest increases, followed by Leiden (+10.7%, €22.69) and Haarlem (+9.5%, €24.05). Percentage increases were even higher in Zwolle (+21.1%) and Dordrecht (+19.5%), but in both cities the composition of available supply changed: in Zwolle, for example, the average size (per square metre) of rental homes fell by more than 15 percent, meaning smaller properties, which typically command higher rents per square metre, influenced the average.
Not all cities recorded increases: rents per square metre fell by 11.9 percent in Bergen op Zoom and by 7.2 percent in Alkmaar. Rents in Amersfoort and Apeldoorn remained broadly stable.
Differences in absolute price levels between cities remain considerable. Amsterdam (€28.53), Amstelveen (€24.17) and Haarlem (€24.05) are among the most expensive cities; Bergen op Zoom (€14.42), Enschede (€15.27) and Apeldoorn (€15.28) among the most affordable. A full overview can be found in the interactive map below.
Click here for an overview of price developments in Dutch cities.
Provinces
In the first quarter of 2026, average rents per square metre rose in almost all Dutch provinces compared with a year earlier. The strongest increase was recorded in Drenthe (+16.0%, €15.96), although it should be noted that the number of rental homes listed in this province is relatively limited, meaning a small number of higher-priced properties can quickly influence the average.
Price pressure is greatest in “the Randstad” 7. Noord-Holland remains the most expensive province in the Netherlands, with an average rent of €25.79 per square metre, up 8.9 percent year on year. Zuid-Holland rose by 10.5 percent to €21.51 per square metre, while rents in Utrecht increased by 6.5 percent to €20.47 per square metre.
Outside the Randstad, increases in Flevoland, Overijssel and Noord-Brabant were also well above the national average. The only province where rents remained broadly stable was Groningen, with a marginal increase of 0.1 percent to €17.69 per square metre.
In almost all provinces, rents rose more strongly than the 2.1 percent inflation rate. Price pressure in the unregulated housing sector is therefore no longer confined to the Randstad.
About Pararius
As the largest independent property portal in the Netherlands, Pararius has been tracking developments in the Dutch unregulated housing sector for many years. The figures in this quarterly rental report are based on rental homes listed and withdrawn via Pararius by professional market participants. These are properties that were genuinely available for rent and for which information on rent levels, property characteristics and listing duration is known.
The data is continuously updated with new listing and letting information, ensuring that the report provides a timely and representative picture of the Dutch unregulated housing sector. The rental report is published on a quarterly basis and is compiled using anonymised listing data. A detailed explanation of definitions and calculation methods is included in the methodology section.
Click here for a detailed explanation of the calculations.
Written by: Jasper de Groot, Femke Radder and Jeroen Wernekinck
Download the full report Q1 2026
Leave your details and download the full rental report in PDF
Request now-
1
Centraal Bureau voor de Statistiek, Wages 4.5 percent higher in first quarter
-
2
Kadaster, Investors 4th quarter 2025: record number of homes sold
-
3
Vesteda, Investors submit €4.1 billion in redemption requests to Vesteda
-
4
Means that the rental property is offered without furniture, flooring, lighting, or window coverings.
-
5
Means that the rental property is offered without furniture, but with flooring, lighting, and window coverings.
-
6
Means that the rental property is fully furnished.
-
7
The Randstad refers to the densely populated western conurbation encompassing Amsterdam, Rotterdam, The Hague and Utrecht.